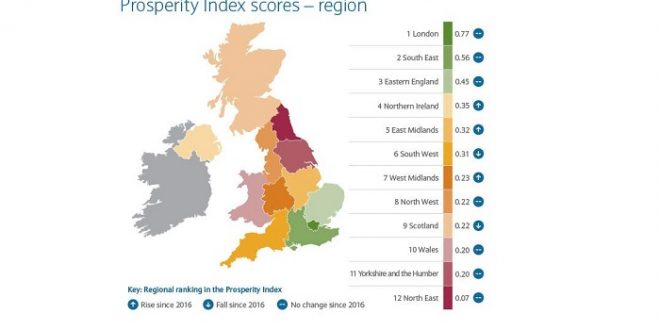
The UK Prosperity Map from Barclays Wealth & Investments is an in-depth view of the different prosperity drivers across the UK regions. The map compiles a series of different measures gleaned from official data – including GDP, employment, enterprise figures, household expenditure and number of millionaires – to give an overall Index score for each region.
UK cities continue to outpace their regions. London remains in 1st place with expenditure growth of 5.9% and the highest GDP per capita, despite only growing by 1.6% ahead of the South East in 2nd place, with the second-lowest level of unemployment at 4% and a 6.1% increase in millionaires. The North East is in bottom or 12th place position. it saw a 4% rise in house prices and a 2.8% rise in GDP.
Scotland dropped two places to 9th despite a GDP per capita rise of 1.8% and average earnings up 2.5%, the third highest in the UK.
The research is compiled by Opinium for Barclays Wealth & Investments. Factors taken into account are;
- Median household wealth
- GDP per capita
- Unemployment rate
- Average weekly household expenditure
- Average house price
- Proportion of pupils with A*-C GCSE grades
- Mean number of paid hours per week
- Mean gross annual pay
- Business birth-to-death ratio
- Insolvency rate
 Homeowners Club If you are one of the 15 million homeowners in the UK, the free to join online Homeowners Club is for you.


